Humanity Podcast: Creating Graphs and Inspiring Story Telling
Dave shared his experiences and insights into the realm of data analysis and visualisation.
In a recent enlightening conversation, Dave shared his experiences and insights into the realm of data analysis and visualisation, emphasising the transformative role of technology in rendering data more accessible and interpretable.
Embracing New Roles in Data Analysis
Dave's foray into data analysis has been marked by surprising successes. Utilising resources like instructional videos, he managed to execute complex tasks such as API calls, JSON file creation, and CSV conversions. This represents a significant leap in skills for someone new to the field.
Integrating ChatGPT for Enhanced Analysis
An interesting twist in Dave's approach was the integration of ChatGPT. He diverged from traditional Excel methods to upload data into ChatGPT, which produced intriguing results. This experiment underscores the growing importance of AI tools in data interpretation and analysis.
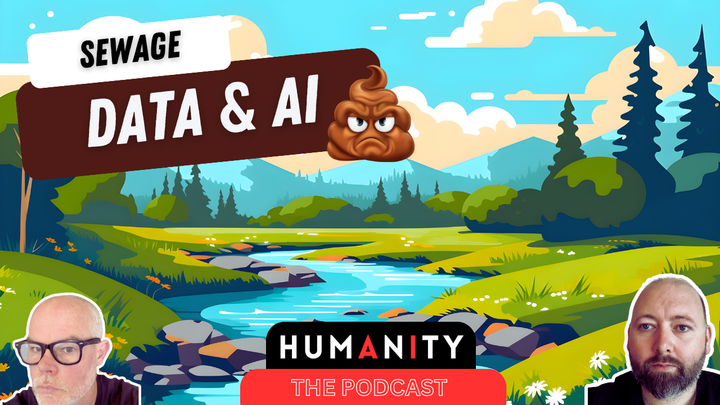
Tackling Real-World Data: The Thames Water Case
Dave's project involved analysing data from the Thames Water sewage map, utilising the latest information provided by their API. By feeding this data into ChatGPT, he was able to glean useful insights, demonstrating the practical applications of AI in processing and interpreting real-world data sets.
Exploring the UI and User Experience
The conversation also touched on the user interface (UI) of these tools. ChatGPT's UI, for instance, was praised for its feedback mechanism, keeping users informed during the analysis process. This feature is particularly beneficial for those without deep technical expertise, allowing them to engage more confidently with the technology.
Translating Data into Actionable Insights
A key achievement of using ChatGPT was its ability to convert complex data into more understandable formats, such as translating hours into days. This capability is crucial for deriving actionable insights from raw data, making it more relatable and easier to interpret for various applications.
Overcoming Limitations and Biases
The discussion also delved into the inherent biases and limitations of AI systems. It's vital to recognise and challenge these biases to ensure accurate and reliable data interpretation. This awareness is essential for anyone working with AI in data analysis.
Visualising Data: Beyond Numbers
A standout moment in Dave's experience was the creation of a pie chart without using traditional tools like Excel. This example illustrates the evolving capabilities of AI in data visualisation, making complex data sets more accessible and understandable.
The Future of AI in Data Analysis
Looking ahead, there's anticipation for advancements in AI technologies like ChatGPT, with potential releases like ChatGPT-5 promising to address current limitations and expand capabilities. These advancements could significantly lower the technological barriers, making data analysis and visualisation more accessible to a broader audience.
Democratising Data: The Bigger Picture
The conversation concluded with a reflection on how these technologies democratise data access. By simplifying data analysis and visualisation, tools like ChatGPT empower individuals and communities to engage with data meaningfully, leading to informed decision-making and action.
checkout city2047.humanity.run to try the tool
Dave's experience as a data analyst using AI tools like ChatGPT highlights a significant shift in data analysis and visualisation. It underscores the growing importance of making data accessible and interpretable to a wider audience, paving the way for a future where data-driven insights are within everyone's reach.